Imagine spotting a 15% surge in a low‑cap token before the broader market catches on. With MasterDEX’s Crypto Heatmap, you can visualise that momentum across 1,000 tokens in real time, without opening dozens of charts. In a market where price swings happen in seconds, a single glance can be the difference between a winning trade and a missed opportunity. Ready to turn colour‑coded bubbles into actionable insights?
Table of Contents:
ToggleKey Takeaways
- MasterDEX Crypto Heatmap tracks ~1,000 tokens across ten blockchains in real time.
- Colors show price direction; bubble size reflects market relevance.
- Multiple timeframes (1H‑90D) let you zoom from intraday spikes to longer trends.
- Filters let you focus on specific chains, token categories, or liquidity tiers.
- Combine heatmap signals with MasterDEX’s DEX Explorer, Swap Aggregator, and PerpDEX for execution.
What is the MasterDEX Crypto Heatmap and how does it help traders?
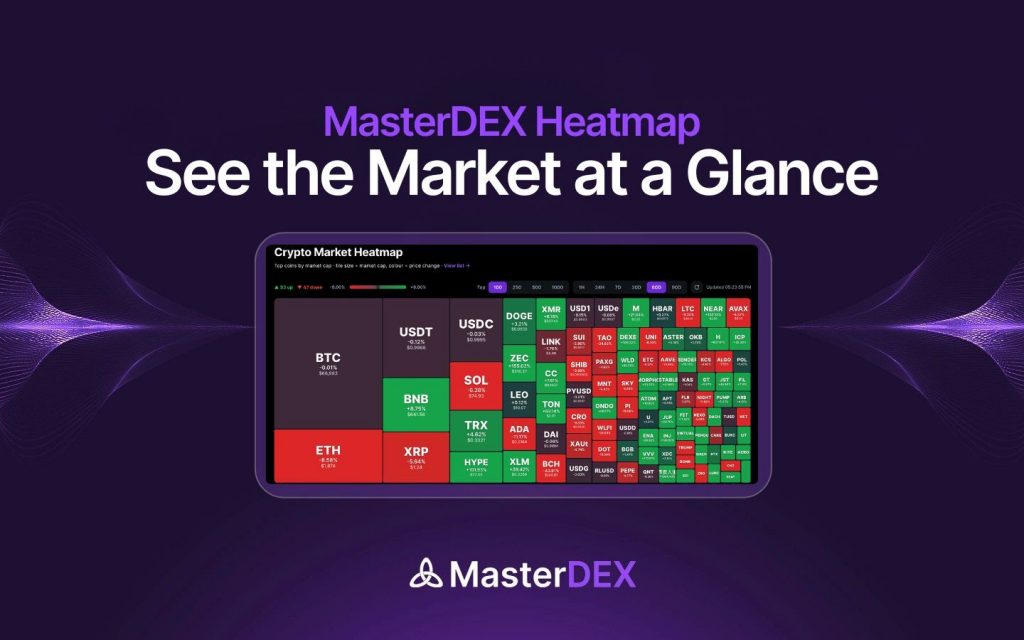
The MasterDEX Crypto Heatmap is a real‑time visual dashboard that displays price movement for the top 1,000 tokens across ten blockchains, using colour‑coded bubbles and size scaling to highlight gainers, losers, and market relevance, enabling traders to quickly identify opportunities and sentiment shifts.
What is the MasterDEX Crypto Heatmap?
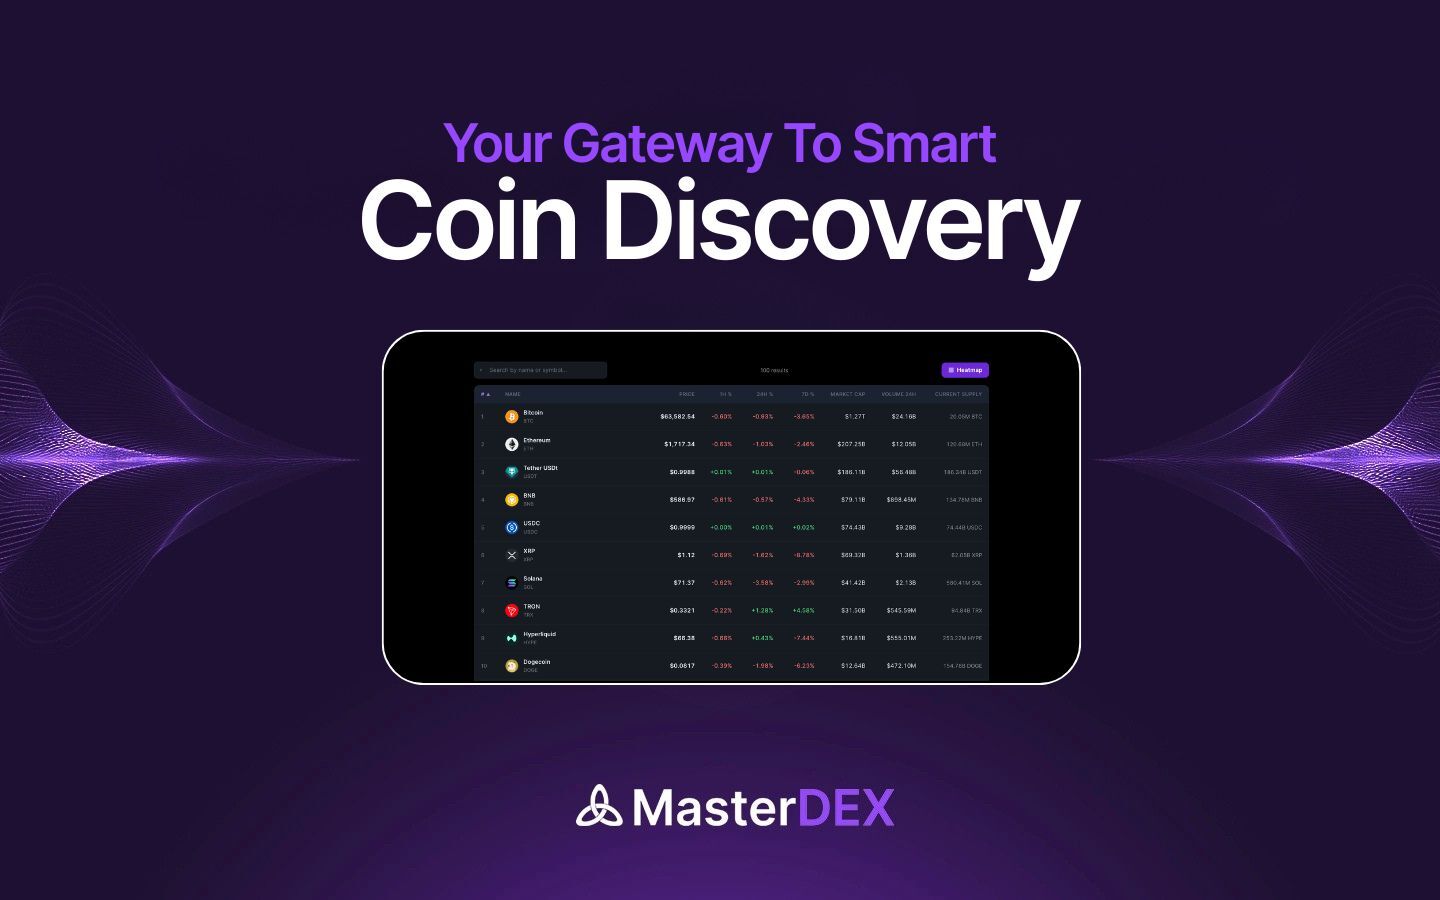
The heatmap is a new feature of MasterDEX (see official page) that aggregates price data from the platform’s DEX Explorer. Each bubble represents a token; green means the price has risen over the selected timeframe, red means it has fallen. The bubble’s diameter corresponds to a relevance score that blends 24‑hour trading volume, liquidity depth, and market‑cap weighting. This dual‑axis visualisation lets you assess both momentum and significance in a single glance.
How to access the MasterDEX Crypto Heatmap
Accessing the heatmap requires no wallet connection. Follow these steps:
- Open masterdex.xyz in your browser.
- Click the “Explore” menu and select “Crypto Heatmap,” or navigate directly to masterdex.xyz/coins/heatmap.
- The default view shows all tokens across the ten supported chains with a 24‑hour timeframe.
Understanding the visual cues: colors, size, and timeframes
MasterDEX uses intuitive visual cues:
- Color: Green indicates a price increase; the shade deepens with larger gains. Red indicates a decline; darker reds signal steeper drops.
- Size: Larger bubbles belong to tokens with higher relevance—typically higher volume or larger market cap. A tiny green bubble might be a niche token that’s rallying, but its market impact is limited.
- Timeframe selector: Choose from 1H, 24H, 7D, 30D, 60D, or 90D. Shorter frames (1H, 24H) surface rapid momentum, while longer frames reveal sustained trends.
For example, a medium‑sized orange‑red bubble on the 7‑day view could indicate a token that has been steadily losing value, suggesting a potential short‑term exit point.
Using the Heatmap to generate trade ideas
Here’s a practical workflow:
- Spot high‑momentum tokens: Filter to a specific blockchain (e.g., Base) and select the 1H timeframe. Look for large green bubbles—these are tokens with strong intraday buying pressure.
- Validate liquidity: Click the bubble to open the token’s detail page. MasterDEX’s DEX Explorer shows real‑time order‑book depth and recent swap routes, confirming whether the price move is backed by genuine liquidity.
- Execute with zero‑fee swaps: From the token page, hit “Swap” to launch the MasterDEX Swap Aggregator. The aggregator will automatically find the best route across 90+ DEXs, ensuring you capture the momentum without extra platform fees.
- Set alerts: Use the heatmap’s watchlist feature to receive push notifications when a token crosses a predefined price‑change threshold.
By iterating this process, you can build a systematic “heat‑driven” trading strategy that leverages real‑time sentiment.
Combining the Heatmap with MasterDEX’s DEX Explorer and Swap Aggregator
The true power of the heatmap emerges when you pair it with MasterDEX’s other modules:
- DEX Explorer: After identifying a token on the heatmap, use the Explorer’s advanced charting (TradingView‑style with 100+ indicators) to confirm technical patterns.
- Swap Aggregator: Execute the trade with MasterDEX’s aggregator, which scans 90+ DEXs on five chains (Ethereum, Base, Polygon, Solana, Cardano) to deliver the optimal rate. The platform also offers MEV protection and limit orders.
- PerpDEX (Base): If you prefer leveraged exposure, the same token’s price can be mirrored on PerpDEX’s BTC‑USDC, ETH‑USDC, or SOL‑USDC futures, allowing up to 10× leverage. Remember the risk disclaimer below.
Risk management and limitations of heatmap‑based analysis
Heatmap visualisations show price direction but do not replace fundamental analysis. Leveraged positions on PerpDEX amplify both gains and losses. Always set stop‑loss orders and never allocate more than a small percentage of your portfolio to a single heat‑driven trade.
Limitations to keep in mind:
- Data latency: While updates are near‑real‑time, network congestion can cause sub‑second delays.
- Relevance weighting: The size metric favours high‑volume tokens, potentially under‑representing emerging micro‑caps that could experience outsized moves.
- Market breadth: The heatmap currently tracks ~1,000 tokens, which is a fraction of the >200,000 tokens indexed by MasterDEX’s Explorer. Niche assets may be omitted.
Heatmap vs. other crypto visual tools
| Timeframe | Best for |
|---|---|
| 1H | Spotting intraday momentum and short‑term breakouts |
| 24H | Identifying daily trend reversals and high‑volume spikes |
| 7D | Assessing week‑long sentiment shifts and emerging patterns |
| 30D | Evaluating medium‑term performance and potential swing setups |
| 60D | Analyzing longer trends for position‑sizing decisions |
| 90D | Strategic allocation and portfolio rebalancing |
Compared to static heatmaps on sites like CoinGecko or price‑index dashboards on CoinDesk, MasterDEX’s heatmap integrates directly with on‑chain data, offers cross‑chain visibility, and provides one‑click pathways to execution.
Frequently Asked Questions
How frequently does the heatmap refresh?
The heatmap updates in real time, typically within a few seconds of on‑chain price changes, ensuring you see the latest market sentiment without manual refresh.
Can I customize the relevance metric?
Currently the relevance score is a fixed blend of 24‑hour volume, liquidity depth, and market‑cap weighting. Future updates may allow users to weight these factors individually.
Is the heatmap free to use?
Yes. MasterDEX provides the heatmap, DEX Explorer, and Portfolio Tracker at no charge. You only pay standard network gas and any LP fees when you execute swaps.
Does the heatmap support tokenized stocks?
The heatmap focuses on crypto tokens. Tokenized US stocks and ETFs are displayed in the dedicated “Tokenized Stocks” section of MasterDEX, not on the crypto heatmap.
What browsers are supported?
MasterDEX’s web interface, including the heatmap, works on Chrome, Firefox, Edge, and Safari. For the best experience, enable hardware acceleration and disable ad‑blockers that might interfere with real‑time WebSocket connections.
Conclusion and next steps
The MasterDEX Crypto Heatmap turns raw price data into an instantly readable map of market sentiment across ten blockchains. By filtering, interpreting colours and sizes, and then acting through MasterDEX’s zero‑fee swap aggregator or PerpDEX, you can shave minutes off your research workflow and capture high‑probability moves. Start exploring the heatmap today, add promising tokens to your watchlist, and let MasterDEX’s suite of tools handle the execution.
Visit the MasterDEX Crypto Heatmap now and turn colour into profit.
Written by MasterDEX Team
The MasterDEX editorial team covers crypto, DeFi, staking strategies, and blockchain technology.