Imagine spotting a breakout token before the rest of the market catches up, using only a single browser tab. In 2026, more than 200,000 crypto assets compete for attention, yet MasterDEX’s Coins page condenses that chaos into a clean, real‑time dashboard. Whether you are a day trader, a long‑term holder, or a DeFi researcher, the Coins page gives you the data you need to make informed decisions—fast.
Table of Contents:
ToggleKey Takeaways
- Live price, market cap, and volume for 5,000 assets update every few seconds.
- Zero‑fee swap routing lets you act on insights without extra cost.
- Heatmap visualization highlights market momentum at a glance.
- Filters let you isolate chains, tokenized stocks, or specific token categories.
- Cross‑checking with CoinGecko or CoinDesk validates data accuracy.
What is the MasterDEX Coins page and how does it help you analyze top cryptocurrencies?
The MasterDEX Coins page is a real‑time market‑discovery tool that lists the top 5,000 crypto assets with live price, market‑cap, 24‑hour volume, and short‑term change metrics, plus an interactive heatmap. It lets you sort, filter, and instantly link to the MasterDEX swap aggregator, turning raw data into actionable trades.
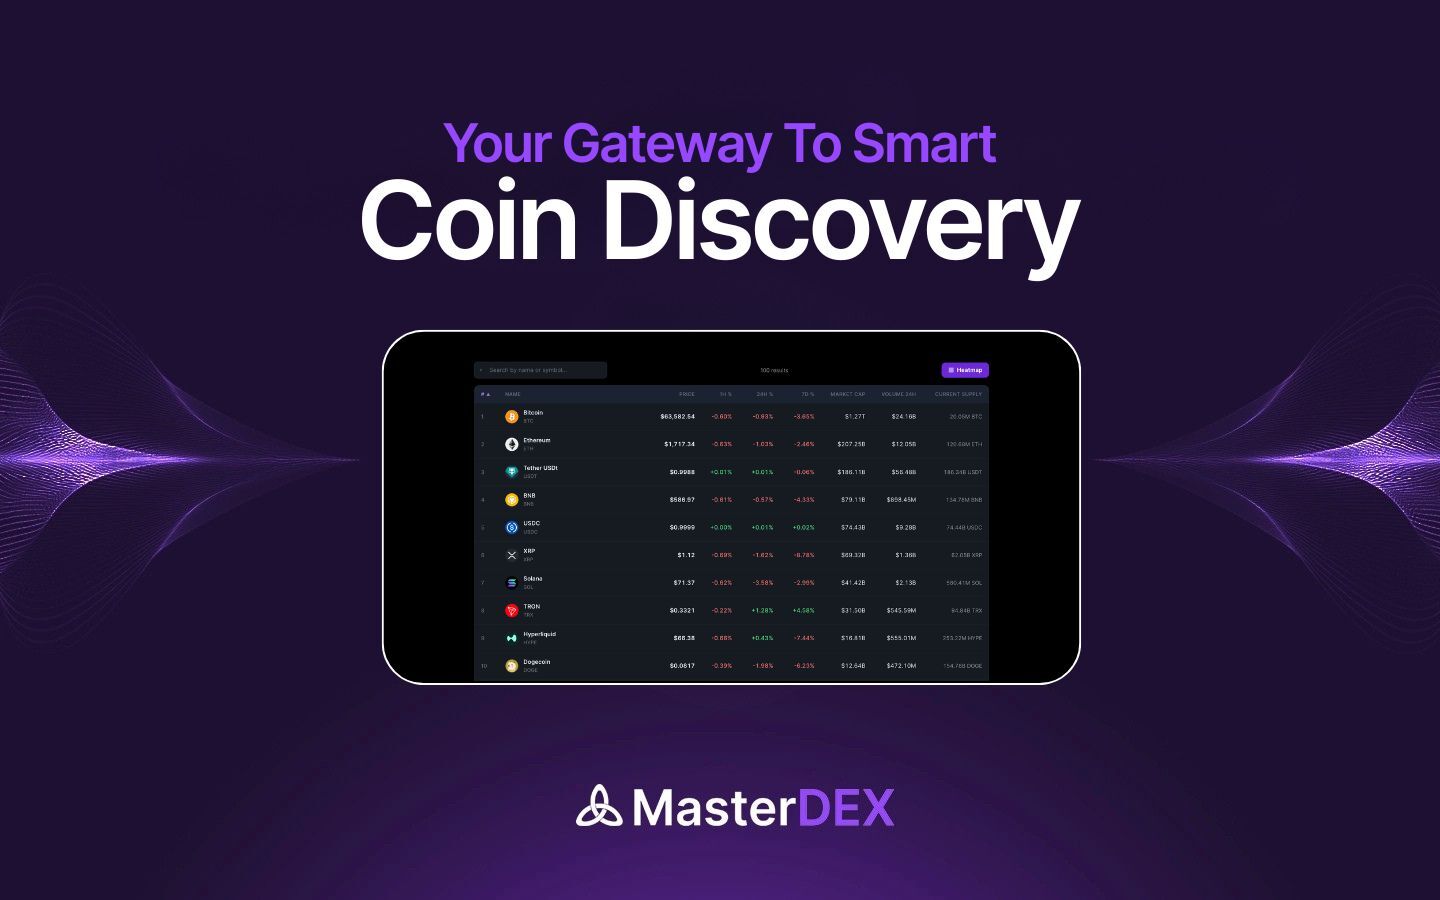
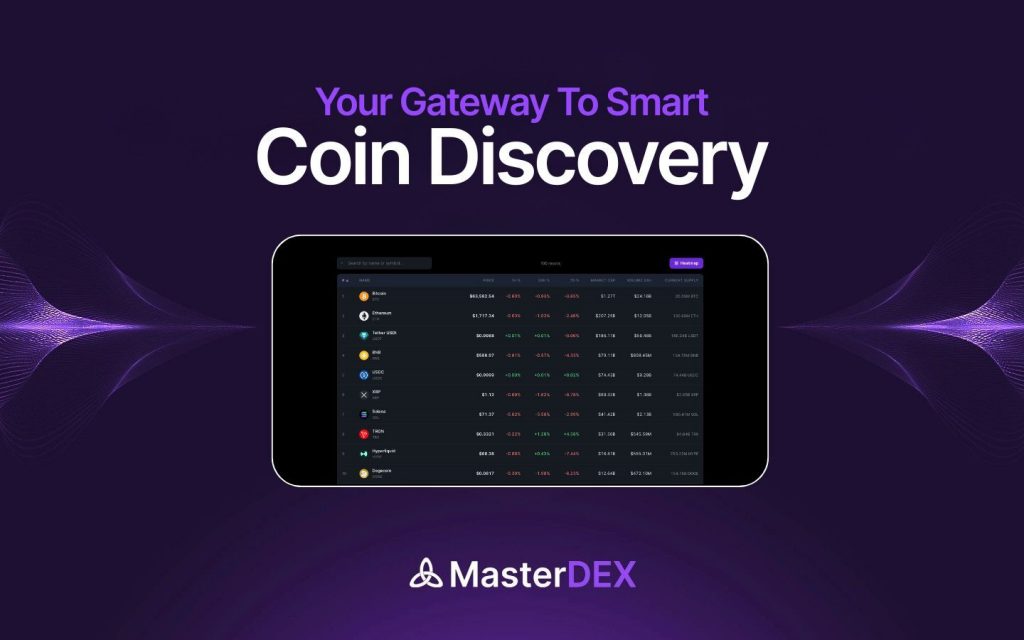
Understanding the Coins Page Layout
The interface is split into three main zones: a sortable table, a heatmap panel, and a quick‑action toolbar. The table contains columns for Rank, Symbol, Price, Market Cap, 24h Volume, and % Change (1h/24h/7d). Hovering over any row reveals a tooltip with the token’s contract address and a link to its security audit in the MasterDEX DEX Explorer.
Table columns explained
- Rank: Position by market cap, updated in real time.
- Symbol: Token ticker; clicking opens the token’s detail page.
- Price: Current price in USDC, displayed to eight decimal places for low‑price assets.
- Market Cap: Price multiplied by circulating supply, a key indicator of overall size.
- 24h Volume: Total traded value across all DEXs in the last 24 hours.
- % Change: Price movement over 1 hour, 24 hours, and 7 days, color‑coded green/red.
Sorting and Filtering Top Coins
Start by clicking the Market Cap header to view the biggest projects first—Bitcoin, Ethereum, and the next 98 assets dominate the space. If you’re hunting for high‑velocity opportunities, sort by 24h Volume or % Change (24h) instead.
Filters sit above the table. Select a blockchain (Ethereum, Solana, Base, etc.) to exclude cross‑chain noise, or choose “Tokenized Stocks” to focus on assets like AAPL or TSLA that trade on Solana.
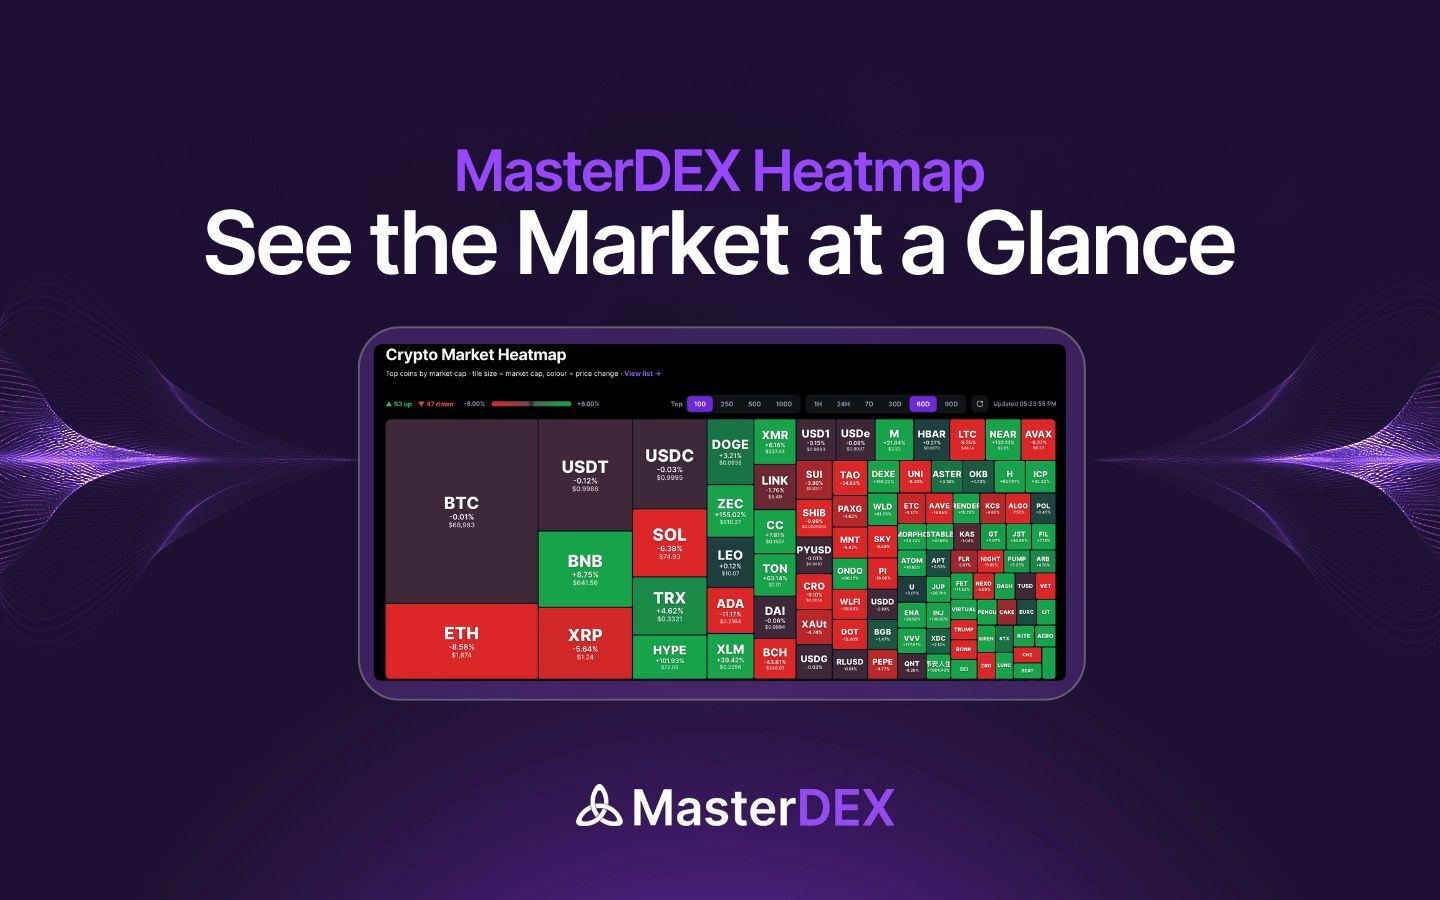
Using the Heatmap for Market Sentiment
The heatmap visualizes each asset as a colored tile. Green tiles represent positive 24‑hour price change, red tiles indicate decline, and the intensity reflects magnitude. Hovering over a tile instantly shows the asset’s name, price, and % change.
This visual cue is especially useful when scanning for sector‑wide moves. For example, a cluster of green tiles in the “DeFi” segment may signal a broader rally, prompting you to investigate the underlying tokens.
Analyzing Liquidity and Volume
High market cap does not guarantee tradable liquidity. Look at the 24h Volume column to gauge how much of an asset actually changes hands on DEXs. A token with $500 M market cap but only $1 M daily volume may experience slippage on larger orders.
MasterDEX’s Swap aggregator protects you from slippage by automatically routing through the deepest pools across 90+ DEXs. The price impact preview shown before confirming a swap tells you the exact percentage your trade will move the market.
Cross‑Checking with External Data Sources
While MasterDEX aggregates on‑chain data, it’s prudent to verify key metrics with reputable aggregators. Open CoinGecko or CoinDesk and compare market cap and volume figures. Consistency across platforms reinforces confidence in the numbers you act upon.
Cryptocurrency prices can swing dramatically within minutes. Always consider your risk tolerance and never allocate more capital than you can afford to lose.
Building a Watchlist and Setting Alerts
Click the star icon on any row to add the asset to your MasterDEX Portfolio Tracker. The tracker consolidates balances across all supported chains and displays real‑time P&L.
Within the watchlist, you can set custom price alerts. For instance, configure a “Buy when BTC‑USDC dips below $27,000” alert; MasterDEX will push a notification to your browser or mobile app the moment the condition is met.
Advanced Tips: Leveraging AI Search and Alerts
MasterDEX’s DEX Explorer includes an AI‑powered search bar. Type “high‑growth DeFi tokens under $2” and the engine will surface assets that meet the criteria, complete with liquidity, audit status, and recent whale activity.
Combine AI search with the heatmap: after receiving a list, sort the results by % change and instantly see which of those tokens are gaining momentum on the heatmap.
Example Analysis: Top 5 Coins (June 2026)
| Rank | Symbol | Market Cap (USD) | 24h Volume (USD) | 24h % Change |
|---|---|---|---|---|
| 1 | BTC | $1.12 T | $42 B | +0.6% |
| 2 | ETH | $530 B | $28 B | +0.9% |
| 3 | USDC | $45 B | $3.2 B | +0.1% |
| 4 | SOL | $22 B | $1.6 B | -0.3% |
| 5 | MATIC | $19 B | $1.1 B | +0.4% |
Notice that while Bitcoin and Ethereum dominate market cap, Solana’s 24‑hour volume remains robust, indicating healthy on‑chain activity despite a slight price dip. Such nuances are why the Coins page’s combined view of cap, volume, and price change matters.
Frequently Asked Questions
How frequently does the Coins page refresh its data?
The table and heatmap refresh every few seconds, pulling data directly from MasterDEX’s DEX aggregator and on‑chain price oracles. This near‑real‑time update ensures you are always looking at the latest market conditions.
Can I export the Coins page data for offline analysis?
Yes. Click the “Export CSV” button at the top‑right of the table. The downloaded file contains all displayed columns, which you can open in Excel or Google Sheets for deeper statistical modeling.
Does the Coins page include token security information?
Each token row links to the MasterDEX DEX Explorer, where you can view honeypot detection, ownership checks, and liquidity‑lock verification. Use this data to avoid scam tokens before you trade.
Are tokenized US stocks treated differently on the Coins page?
Tokenized stocks appear alongside other assets but carry a “Stock” label. They settle on Solana within ~1 second and are fully backed 1:1 with the underlying equity, offering fractional ownership and 24/5 market hours.
What fees will I pay when swapping a coin discovered on the Coins page?
MasterDEX charges zero extra fees on top of the underlying DEX protocol fees. You only pay the standard LP fee (typically 0.3%) and the network gas cost for the transaction.
Conclusion: Turn Data Into Action With MasterDEX
The MasterDEX Coins page transforms a sprawling crypto market into a focused, data‑rich workspace. By mastering sorting, heatmap analysis, AI search, and watchlist alerts, you can spot opportunities before they become mainstream. Ready to put your insights into practice? Visit MasterDEX Coins page now, build your watchlist, and execute a zero‑fee swap in seconds. Your next profitable trade starts with the right data—grab it today.
Written by MasterDEX Team
The MasterDEX editorial team covers crypto, DeFi, staking strategies, and blockchain technology.