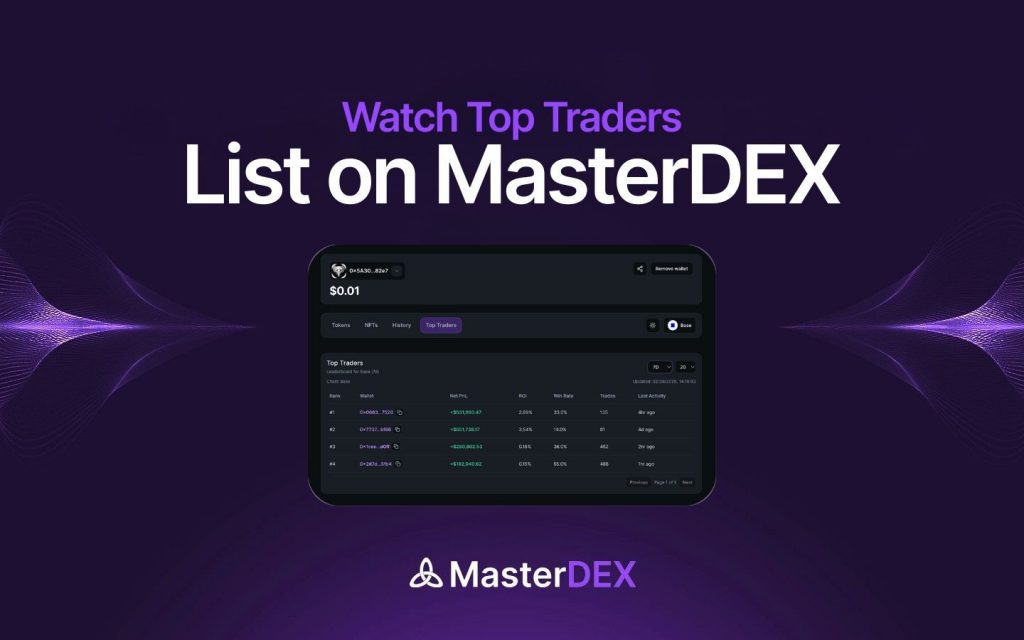
Imagine watching a single dashboard that surfaces the most profitable wallets across Base, Solana, and Ethereum in real time. What if you could filter those wallets by ROI, trade frequency, or recent activity and instantly see which strategies are delivering the best returns? MasterDEX makes that possible with its Top Traders feature, turning opaque on‑chain data into actionable insight.
Table of Contents:
ToggleKey Takeaways
- MasterDEX aggregates on‑chain data from three major blockchains into a single, sortable leaderboard.
- You can filter by timeframe, chain, and performance metric to surface the most relevant traders.
- Each trader profile includes a full transaction timeline, ROI, net PnL, and risk flags for leveraged positions.
- The feature is free; you only pay network gas for any on‑chain actions you take.
- Integrating top‑trader insights can improve swap routing, timing, and overall portfolio performance.
How to discover top traders on Base, Solana, and Ethereum?
Open MasterDEX’s Portfolio page, select the Top Traders tab, choose your preferred chain, apply performance filters (e.g., 30‑day ROI), review individual wallet profiles, add promising addresses to your watchlist, and replicate their high‑ROI entry‑exit points using the MasterDEX Swap aggregator.
How to discover top traders on Base, Solana, and Ethereum
The process is deliberately simple so you can spend more time analyzing trades than navigating menus. Below is a step‑by‑step walk‑through, followed by deeper tips on interpreting the data.
Open the MasterDEX Portfolio dashboard
Visit masterdex.xyz/portfolio and connect your wallet. MasterDEX is non‑custodial, meaning your private keys never leave your device. Once connected, you land on a clean overview of your holdings, recent swaps, and a set of tabs across the top of the page.
Activate the Top Traders tab
Click the “Top Traders” tab. The platform instantly loads a leaderboard that pulls data from three blockchains—Base, Solana, and Ethereum. The default view shows the top 10 wallets on each chain, ranked by net profit‑and‑loss (PnL) over the past 7 days.
Filter and analyze trader performance
Raw rankings are useful, but the real power lies in the filters. MasterDEX lets you narrow the list by timeframe, metric, and even token exposure.
Timeframe filters
Choose from 1D, 7D, 30D, or 90D windows. Short‑term windows highlight day‑traders and arbitrageurs, while longer windows surface more sustained strategies. For most users, the 30‑day ROI filter provides a balanced view of consistency and upside.
Metric sorting
Click any column header—Net PnL, ROI, Trade Count, or Last Activity—to sort the list. ROI (return on investment) is expressed as a percentage and accounts for both realized and unrealized gains, making it a reliable indicator of efficiency.
Token exposure view
Hover over the “Tokens” column to see a mini‑pie chart of each trader’s asset allocation. This quick visual cue helps you spot whether a wallet is concentrated in a single token (e.g., $SOL) or diversified across multiple assets.
Interpret metrics and avoid pitfalls
Even the most impressive ROI can hide risk. MasterDEX flags leveraged positions, high‑frequency bots, and wallets that have recently liquidated.
Risk warning: Leveraged trading can amplify both gains and losses. Always assess the underlying risk profile before copying a leveraged trader’s strategy.
Understanding ROI
ROI is calculated as (Current Value – Initial Capital) ÷ Initial Capital × 100%. A 150% ROI over 30 days is extraordinary, but check the “Leverage” badge. If the trader used 5× leverage, the true capital efficiency may be lower than it appears.
Identifying bot activity
Bot accounts often execute dozens of trades per minute and show near‑zero time between swaps. MasterDEX marks such wallets with a “Bot” icon and provides a “Trade Frequency” metric. While bots can be profitable, they also carry higher execution risk, especially during network congestion.
Integrate top‑trader insights into your strategy
Once you’ve identified a handful of promising wallets, the next step is to translate their actions into your own trades.
Copy trade timing
Open the trader’s profile and note the timestamps of entry and exit swaps. Use MasterDEX’s Swap aggregator to execute similar routes at comparable price impact. Because the aggregator scans 90+ DEXs across five chains, you’ll often find a route with lower slippage than the original trade.
Adjust for your risk tolerance
If a top trader uses 8× leverage on PerpDEX, you might replicate the underlying spot exposure instead. Swap the leveraged token pair (e.g., BTC‑USDC) for a direct BTC purchase on the Swap aggregator, preserving the directional view while eliminating liquidation risk.
Track performance over time
Add the wallet to your personal watchlist by clicking the star icon. The watchlist appears on your Portfolio page, updating net PnL in real time. Over weeks, you can see whether the trader’s edge persists or fades.
Compare MasterDEX Top Traders with other tools
Several platforms claim to surface “smart money,” but MasterDEX’s multi‑chain approach is unique. Below is a quick comparison.
| Feature | MasterDEX | TokenAnalyst (Beta) | Dune Analytics |
|---|---|---|---|
| Chains covered | Base, Solana, Ethereum | Ethereum only | Custom queries (any chain) |
| Real‑time leaderboard | Yes (seconds) | Hourly refresh | No built‑in leaderboard |
| Leverage flag | Automatic | Manual tagging | None |
| Zero extra fees | Yes | Yes (platform fee) | Depends on query tool |
| Export CSV | Built‑in | Premium only | Manual via API |
MasterDEX’s advantage lies in its unified UI, instant updates, and built‑in risk signals—all without requiring custom queries or premium subscriptions.
Frequently Asked Questions
Can I use the Top Traders data for automated bots?
MasterDEX provides the raw on‑chain data, but the platform does not offer a native API for automated execution. You can export the CSV and build your own bot, keeping in mind that copying trades in real time may incur higher gas costs and slippage.
How often does MasterDEX refresh the leaderboard?
The leaderboard updates every few seconds as new blocks are indexed. This near‑real‑time refresh ensures you see the latest profit and loss figures, unlike services that refresh hourly or daily.
Do the rankings include wallets that trade on centralized exchanges?
No. MasterDEX only tracks on‑chain activity from decentralized protocols. Centralized exchange accounts are invisible to the blockchain and therefore excluded from the Top Traders list.
Is there a way to see a trader’s historical performance beyond 90 days?
Currently the UI caps at a 90‑day window, but you can download the CSV and run your own analysis for longer periods. Future updates may extend the on‑platform view.
What should I do if a top trader suddenly shows a large loss?
Investigate the cause: a leveraged position may have liquidated, or the trader could be shifting strategy. Use the risk flag and check recent transaction notes. It’s prudent to diversify your watchlist rather than rely on a single wallet.
Conclusion – Turn insight into action
MasterDEX’s Top Traders feature transforms raw blockchain data into a practical advantage. By filtering for ROI, monitoring risk flags, and integrating the most profitable entry‑exit points into your own swaps, you can stay ahead of market moves on Base, Solana, and Ethereum. Ready to see the smart money in action? Open MasterDEX now, add your favorite wallets, and start trading with confidence.
Written by MasterDEX Team
The MasterDEX editorial team covers crypto, DeFi, staking strategies, and blockchain technology.